Use case: Data visualization
Our cloud based app is made based on the user interaction between marketers, analysts and retailers with data including visitors interaction, listeners behaviour (for podcast) and more.
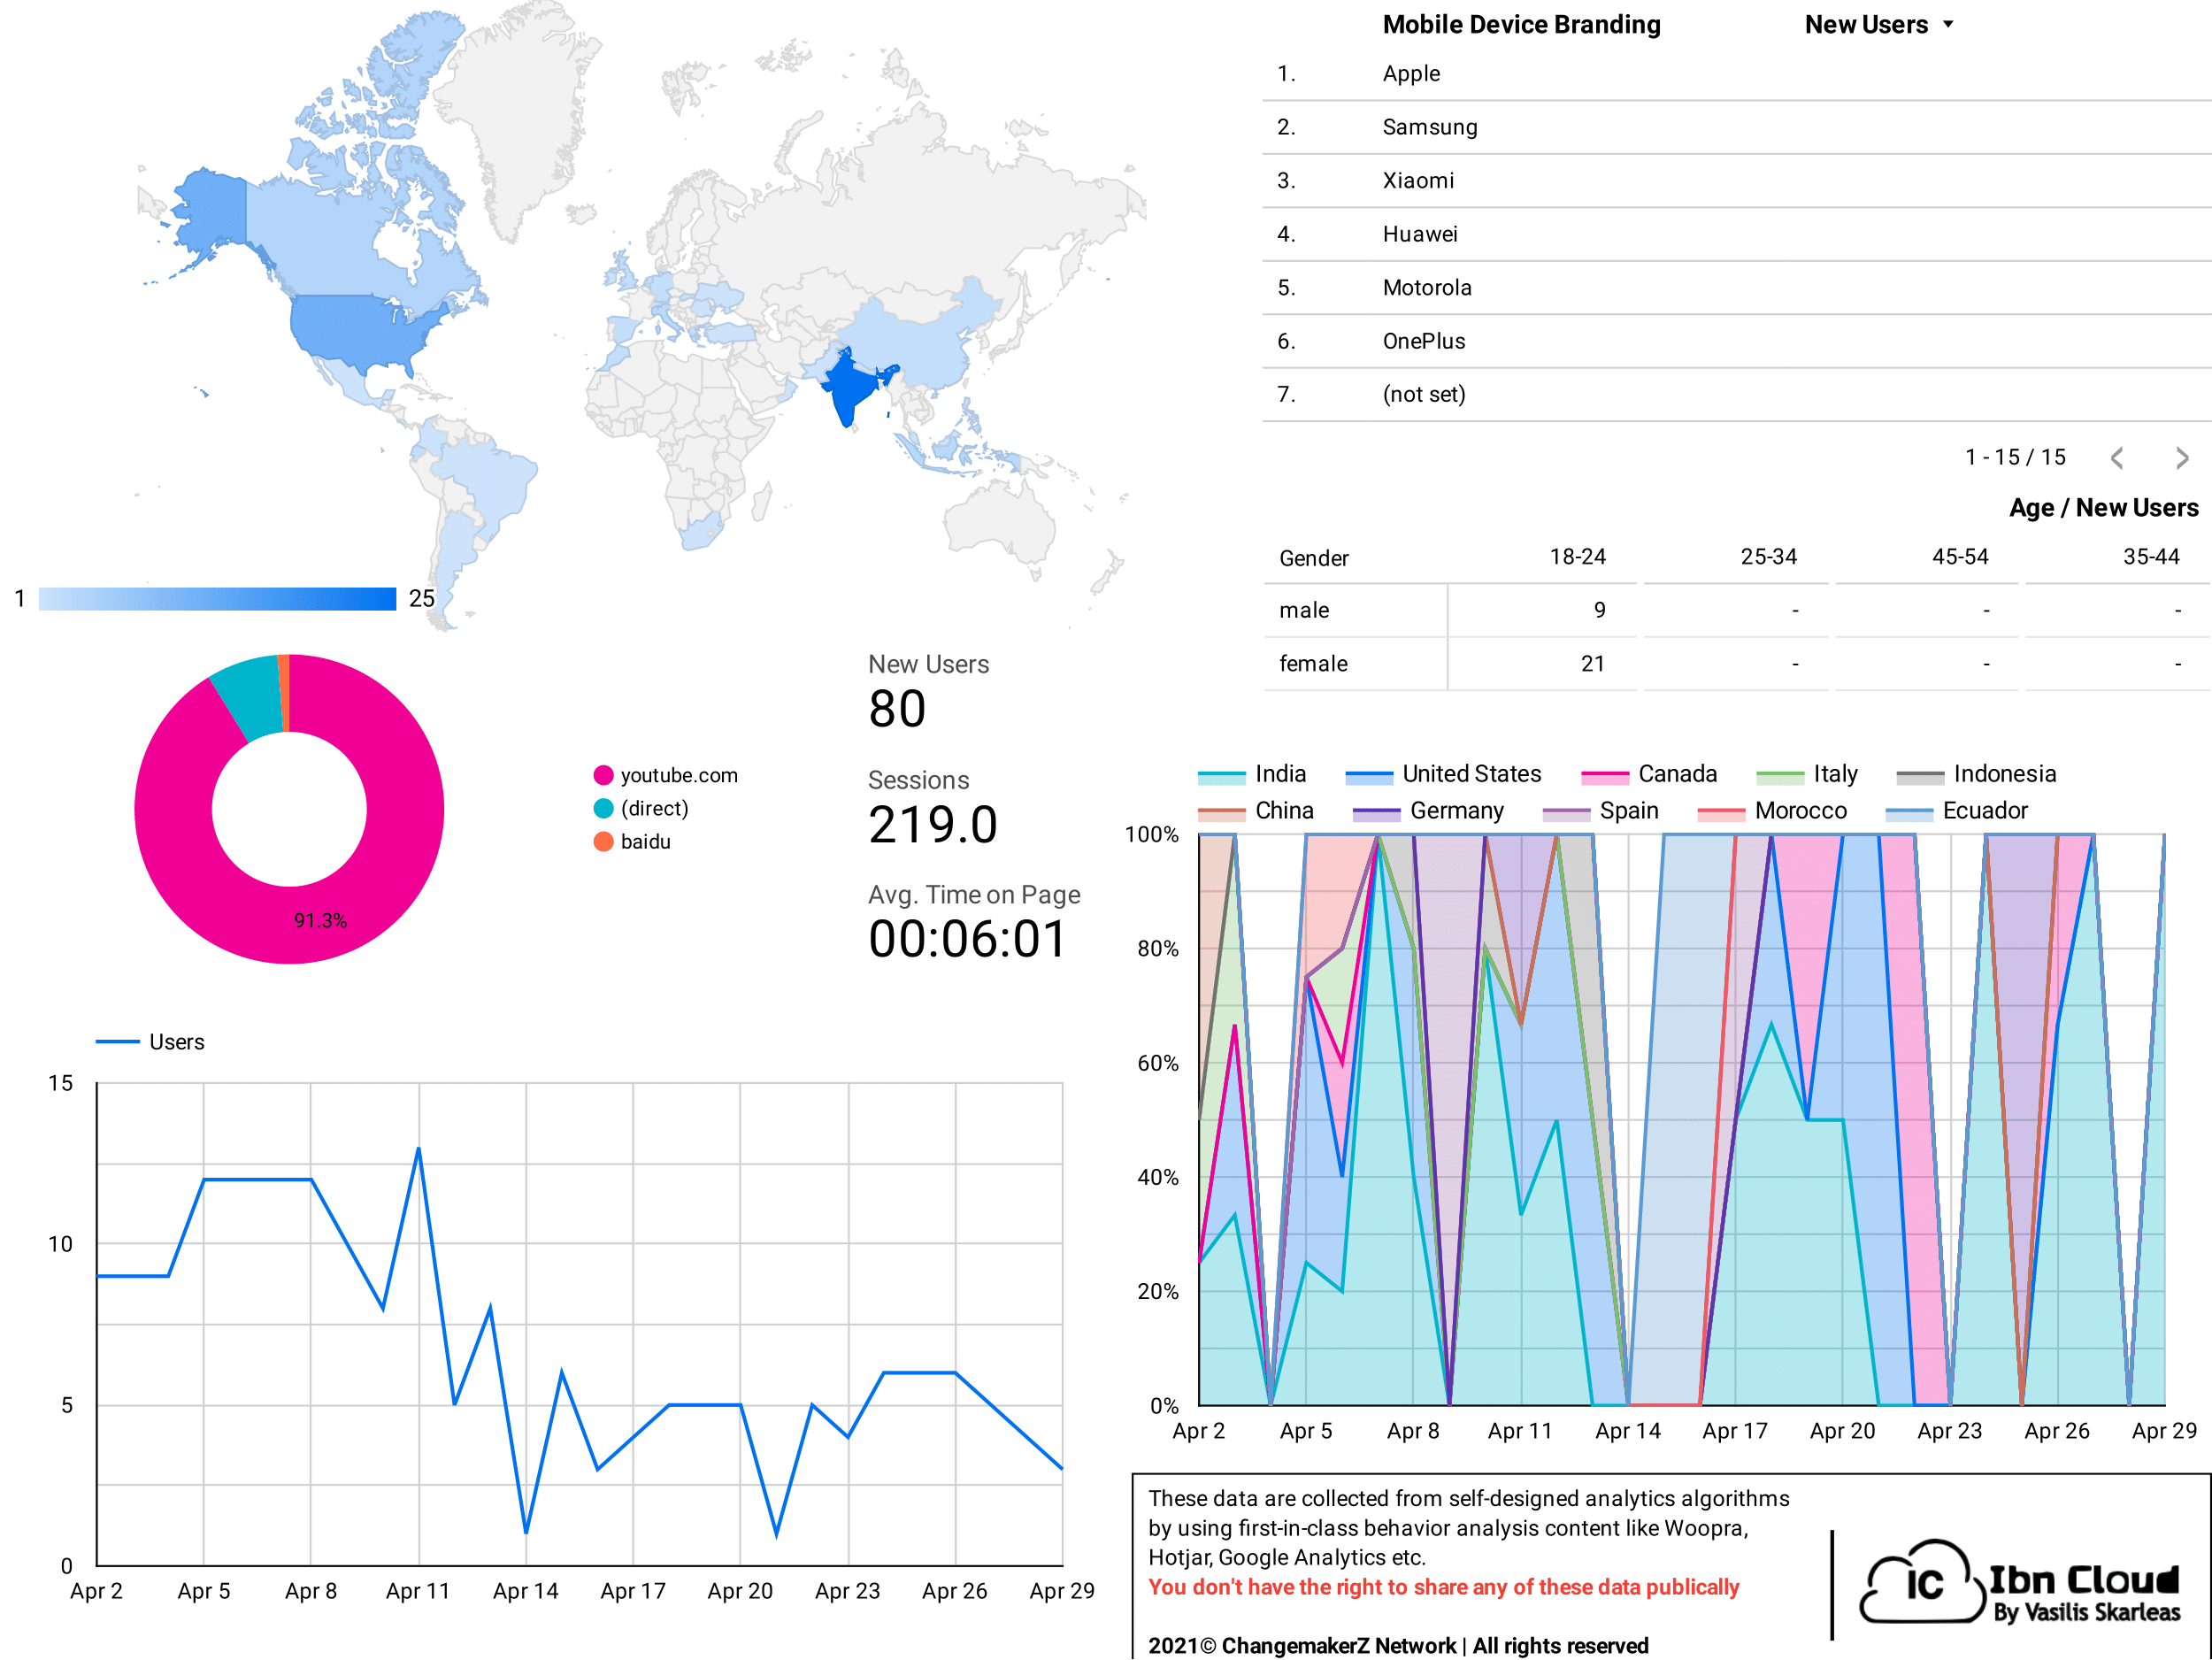
Our IT Department creates personalised dashboards and data boards which have plenty different data sources according to the needs of the account. The dashboards have interactive elements and also they can offer the ability to select the time range that you are visualising each time. You can see an example below.